
In the UK, many of us spend more than two hours a day commuting to work. And many of us are willing to put up with even longer commutes.
Crazy, but true!
Cars are by far the most popular form of transport over here, in contrast with countries like the Netherlands where there are more bikes (18 million) than there are people (17 million). Our driving dependence could be blamed on a number of things, including the perceived convenience of cars, and the lack of infrastructure to make cycling simple.
This got us thinking…
- What is the cost of commuting to work?
- What is the damage to our pockets, environment, health and happiness?
- Is there a better way to get to work than sitting in a car?
We started researching the facts and running the figures through our calculators. We were amazed by the results, and we think they’ll be an eye opener for you too.
Let’s see how cycling can help you conquer the commute and kill the costs of driving.

How do we commute?
- 3.5% of us are blessed with no commute1
- 6.9% walk to work2
- 10.5% use some form of public transport3
- 37.1% drive to work4
- Only 1.9% cycle to work5
This means nearly 20 times more people use a car than a bike for their commute.
How far do we commute? And for how long?
- 15km
The average distance we commute to work in England and Wales (9.3 miles), according to 2011 figures from the Office for National Statistics.6. - 57.1 minutes
In 2015 the average commute took just under an hour7.

In our calculations we have assumed:
- 30km
Average commute distance each way - 2 hours
Average commute time each way - 1 year
We have looked at the cost of this over 12 months
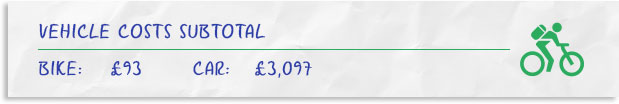
Vehicle costs
We turned to the experts for recommendations on suitable commuting models: Parkers for the car and the Merlin Performance PR7 for the bike.
- Bike (Merlin Performance PR7): £3998
- Car (Ford Focus ST hatchback): £22,1959
With 30 million cars on our roads and 7 million changing hands every year, this suggests the average car ownership lasts 4.3 years. And, in the absence of any hard data, we applied this to bikes as well.
This gave us an annual cost of:
- Bike (Merlin Performance PR7): £93
- Car (Ford Focus ST hatchback): £5,161
We’ve allowed the car to retain a generous 40% of its value after four years, and factored this £8,878 in11. The final annual cost of the vehicle alone is £3,097 for a car.
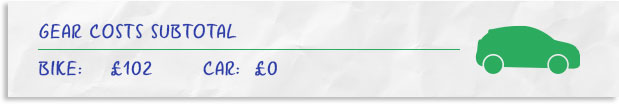
Gear costs
The car won hands down on this: there’s not a lot extra you need.
With bikes however, you can power up with various accessories. We’ve erred on the side of deluxe in our costs, but divided the total by the expected lifespan of 4.3 years to get an average cost per year.
Bike
- Lights: £35
- Pump: £25
- Inner tubes x 8: £40
- Multitool: £50
- Lock: £30
- Bag: £100
- Tyres x 4: £160
- Total for 4.3 years: £440
- Bike extras total: £102
Car
- No extras: £0
Insurance costs
The jury is out on whether you actually need bike insurance or not12. We’ve quoted for the average of adding it to your home insurance and taken the ABI’s latest data for cars13.
- Bike insurance: £73
- Car insurance: £462

Fuel costs
Bikes
Other than a good breakfast of Weetabix, there are no fuel costs for bike: £0
Cars
- An average new car fuel economy of 5 litres/100km, in line with EU goals14
- An average distance of 30 km a day
- Giving us 1.50 litres a day
- There are 253 commuting days in a year: 380 litres
- At £1.19 per litre15
- Total car fuel cost: £452

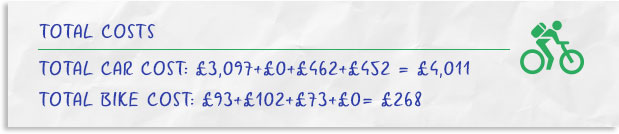
Total car and bike costs each year
Totting all these up, we arrive at the total cost each year of using a car or bike.
That means…
Commuting by car is over 14 x more expensive than commuting by bike.
And we haven’t even factored in parking costs, MOTs, services and road tax!
But there are costs other than financial to take into account…

Environmental costs
Based on UK government data the average CO2 emissions for new cars is 122.1g per 1 km16. That means a 30km round trip pumps out 3.663kg of CO2. Your bike, of course, pumps out nothing.
Let’s multiply these by the 253 commute days each year.
- Total CO2 car: 927kg
- Total CO2 bike: 0kg
Health costs
We’re going to be lenient on cars and say that you burn a total of zero calories on your commute, not taking into account the unhealthy crisps and sweets that some of us typically pop in our mouths during the drive!17.
On an average commute, a cyclist will be biking for two hours – one hour each way18.
During this time, they are likely to burn between 864 calories and 1,902 calories, depending on factors such as their weight and speed19.
Looking at this over the 253 commutes each year, we were staggered to discover just how many calories a bike to work can burn:
- Total calories burned by car: 0
- Total calories burned by bike: 218,592 to 481,206
Happiness cost
This metric is slightly less tangible and quantifiable, but it’s worth looking at the cost to us of being stuck in that car for an hour a day, compared with coasting along on a bike.
A 2014 ONS study concluded that the longer the car commute the more suffering and that, in general, “commuters have lower life satisfaction, a lower sense that their daily activities are worthwhile, lower levels of happiness and higher anxiety than non-commuters.”20.
In contrast, they found that cycling for more than 30 minutes a day to work saw wellbeing increase21.

So, there we have it.
Here are the commuting costs over one year for bikes vs cars:
| Cars | Bikes | |
|---|---|---|
| Financial: | £4,011 | £268 |
| Environmental: | 927kg of CO2 | 0 |
| Calories lost: | 0 | At least 218,592 |
| Happiness cost: | Lower levels of happiness | Wellbeing increases |
Cars Bikes
Financial: £4,011 £268
Environmental: 927kg of CO2 0
Calories lost: 0 At least 218,592
Happiness cost: Lower levels of happiness Wellbeing increases
We think the facts speak for themselves.
Cycling to work will save you money, get you fit and show your love of the Earth. It may even make you smile!
If you’re ready to start pedalling, let’s get you kitted out and on the road today. With our fantastic range of commuter bikes and accessories you’ll be looking as good as you feel.
See you on the road!
Sources
1https://www.theguardian.com/news/datablog/interactive/2013/feb/01/cycle-drive-work-map-census-2011 2https://www.theguardian.com/news/datablog/interactive/2013/feb/01/cycle-drive-work-map-census-2011 3https://www.theguardian.com/news/datablog/interactive/2013/feb/01/cycle-drive-work-map-census-2011 4https://www.theguardian.com/news/datablog/interactive/2013/feb/01/cycle-drive-work-map-census-2011 5https://www.theguardian.com/news/datablog/interactive/2013/feb/01/cycle-drive-work-map-census-2011.
6http://webarchive.nationalarchives.gov.uk/20160107181447/
7http://www.ons.gov.uk/ons/dcp171776_357812.pdf http://www.bbc.co.uk/news/uk-38026625
8http://www.bikeradar.com/commuting/gear/article/whats-the-best-bike-for-cycle-commuting-29898/
9http://www.parkers.co.uk/company-cars/2016/top-cars-for-commuting/
10http://www.autoexpress.co.uk/car-news/96830/whats-the-average-age-of-our-cars
11http://www.theaa.com/car-buying/depreciation
12http://www.thisismoney.co.uk/money/bills/article-2343125/Best-bike-insurance-need-insure-bicycle-cover-available.html
13https://www.theguardian.com/money/2017/apr/21/uk-car-insurance-premiums-rise-whiplash-tax-motorists
14https://ec.europa.eu/clima/policies/transport/vehicles/cars_en
15http://www.bbc.co.uk/news/business-21238363
16https://www.gov.uk/government/publications/new-car-carbon-dioxide-emissions
17http://calorielab.com/burned/?mo=se&gr=16&ti=Transportation&wt=150&un=lb&kg=68
18https://en.wikipedia.org/wiki/Bicycle_performance
19http://www.livestrong.com/article/320784-how-many-calories-are-burned-on-a-20-minute-bike-ride/
20http://webarchive.nationalarchives.gov.uk/20160107224314/
21http://www.ons.gov.uk/ons/dcp171766_351954.pdf